
How IT
Works
Our System
Our system involves two sensors: one 3-axis accelerometer mounted to the user's dominant arm, and one wireless accelerometer mounted to the bottom of the frisbee. The data collected from these two sensors in conjunction allow us to determine:
-
Angle of Release: The angle at which the frisbee is released by the thrower relative to the ground.
-
Acceleration: The acceleration at which the frisbee is released by the thrower.
A second part to our data collection and analysis involved attempting to evaluate the motion of a frisbee based on gyroscope and accelerometer data captured by the wireless sensor.
Determining the parameters
Since our goal is to analyze the throw of a frisbee, we expected to see some very large accelerometer readings. Given that smartphone sensors max out at 2G’s, we were tasked with coming up with creative methods to capture the necessary data. At first we considered mounting a smartphone to the user’s torso to capture the accelerometer and gyroscope data as the user twisted and untwisted their body during the throwing motion. After discussing this option with peers and professors, this idea was abandoned in favor of using a wired, 10G accelerometer mounted to the thrower’s arm instead. This accelerometer was then supplemented by a 2G, wireless Bluetooth sensor mounted to the underside of the frisbee.
After determining the preliminary placement of the sensors on the user, we were able to break down the components of motion that we expected to see. Assuming that the user is throwing backhand (leading the throw with the back side of their hand), we were able to determine the expected behavior of each component of acceleration as the throw progresses. We chose to only analyze backhand throws because most Ultimate players find it to be more natural and tend to prefer it for long-range passes.

The wired sensor was placed in the orientation shown, with positive x was with respect to the direction of travel of the frisbee. If the user was right-handed, positive y was aligned along the users’s arm, pointing in the global y-direction. If the user was left-handed the alignment remained the same but positive y pointed towards the ground. The z-axis was then oriented normal to the thrower’s arm, with positive z pointing out of the global reference frame. If the user was left-handed, then their positive z axis pointed into the global reference frame.
Quick trial runs indicated that mounting the wired accelerometer to the back of the user’s hand or forearm still made it too easy to max out the sensor, and the wireless sensor’s 10 Hz sampling rate was much too low to accurately capture the rotation of the frisbee over time. So, for the official data collection, we fixed the wired accelerometer near the thrower’s shoulder as shown below.
Our final setup includes two sensors, one wired and one wireless, the former of which only records 3-axis accelerometer data, and the latter of which measures both accelerometer and gyroscope data, with only a 10 Hz sampling rate and a Bluetooth range of approximately 15-20 feet.
Part One: Motion of the Throwing Arm
To capture data of the user’s arm, we attached the 3-axis sensor to the upper part of the dominant arm of 5 different Ultimate frisbee players who were present at the Olin College-hosted Fall Ultimate tournament. After beginning data collection on both the wireless sensor and the 3-axis accelerometer, we asked the player to hold the disc parallel to the ground and jump straight up and down once before attempting to throw the frisbee as far as they could with a backhand. The jump was added so that we could sync up the data collected from the two sensors during our analysis. After the disc had landed, we measured the total distance traveled of the disc with respect to the global positive x-direction.
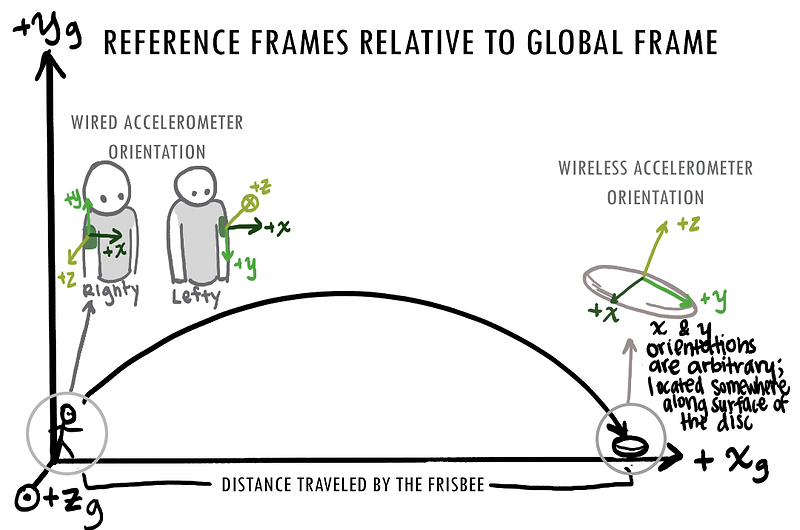
This figure shows the local reference frames with respect to the global reference frame. We expect the local z-axes to remain fairly constant throughout the trajectory while the x and y-axes are expected to change dramatically over the course of the motion.
MotION MODEL: USER ACCELEROMETER
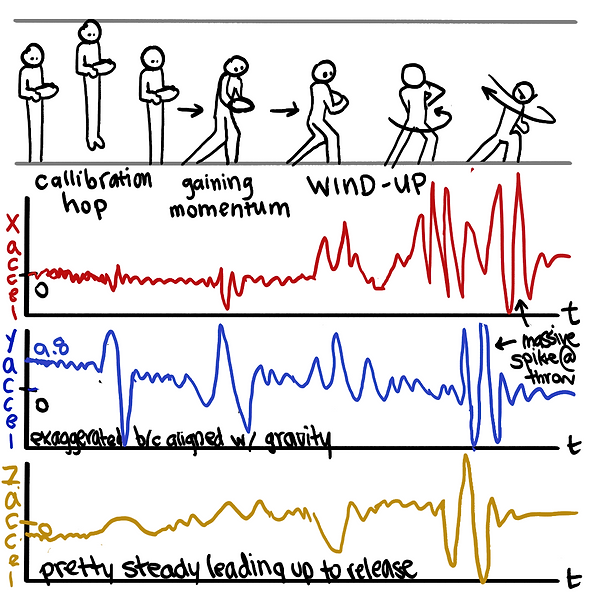
As shown above, we expect acceleration to remain steady at around 0, except for the y-axis which should be oriented along the axis corresponding to gravity. When the user jumps, we expect a small spike in the data, followed by a couple smaller spikes indicating that the user is either taking steps or winding up their throw. When the user releases the frisbee, we expect to see a massive spike in acceleration from both the shoulder and the disc.
These graphs show the data collected from the wireless accelerometer mounted to the disc versus the accelerometer mounted to the user. The third subplot of each shows the two sets of data superimposed on each other. You can clearly see the moments where the user jumps, begins the wind-up motion, and releases the frisbee by the spikes in the graph.


We also assume that the frisbee is being held in line with the user’s forearm throughout the wind-up and release motions. This enables us to determine the angle of attack based on the accelerometer data of the disc at the moment of release. We were forced to make this generalization because the accelerometer and gyroscope data from the wireless sensor mounted to the frisbee appeared to routinely lose the actual moment of release in between samples due to its low sample rate. In the illustration above, the dark green shows our abstraction of how the frisbee could remain in the same plane as the wired accelerometer. The bright green gravity vector shows what we used to reference our angle of attack.
Part two: Motion of the DISC

Here we show what we expected to see from the accelerometer mounted to the frisbee in the moments leading up to the release of the disc. Since the x and y-components of acceleration are both oriented along the flat surface of the disc, we did not expect to see very extreme changes until the user's wind-up and release motion. The z-axis would ideally be oriented with respect to gravity, so we did not expect to see any changes except for those that were caused by noise until the wind-up and release motion, when sudden changes in the tilt of the disc would cause spikes in the acceleration.
For the flight of the frisbee, We assume that the sensor rotates about its own center axis with the frisbee. Because of this, we approximate the motion of the sensor attached to the frisbee to be parabolic with a circular spin on itself. We expect to see near constant acceleration in the z-direction, with any changes corresponding to the tilt of the disc throughout its trajectory. In the first moments of the trajectory, we expect to see a periodic change in the x and y components of acceleration, as the sensor spins at the frequency of the frisbee off of its axis. If the frisbee reaches a point where it is spinning level with the z-axis (in other words, there is no tilt of the disc), then we expect to see a perfect gravity vector, with the x and y components equal to zero and the z component equal to the force of gravity on the disc. When the frisbee hits the ground we again expect to see a spike in the accelerometer data.
The vertical red lines in the figures show the range of frequencies that can be accurately captured with the Bluetooth wireless accelerometers. It becomes very clear through this Fourier Analysis that the data that we had available to analyze did not give us enough information to accurately determine the behavior of the disc.
We instead analyze the data provided by the gyroscope. We expected the gyroscope data to begin at zero, increase as the thrower winds up, and spike as the thrower releases the frisbee. While in flight, we expect to see a periodic change in the x and y components whose frequency gradually decreases until the frisbee comes to rest.
Unfortunately, given that the maximum sampling rate of the wireless sensor is 10 Hz, it is impossible to accurately reconstruct any frequencies that are greater than 5 Hz. This is a much, much lower frequency than the frisbees that were thrown by any of our Ultimate players, even when they were asked to perform their “weakest” toss. Therefore, we were unable to make any quantitative conclusions about the motion of the frisbee due to the sheer amount of data loss.


